Watch voting activity and revenue
The Dashboard shows how fast votes are coming in, where they come from, how much money has been paid and which payments need attention.
Who can do thisSuper AdminAdminViewer
Choose Dashboard at the top of the left menu. The poll boxes sit among the other boxes. Everything here counts paid votes only. A Viewer sees the four poll boxes (Polls, Paid votes, Paid votes by location and Revenue) but not Payment problems. Finance sees an empty Dashboard.
Polls
Votes / min is the number of paid votes in the last 5 minutes, averaged per minute. Next to it is one box for each open poll, showing its total paid votes, the money taken and the number of orders, and below that the entrant who is currently leading. A closed poll does not appear.
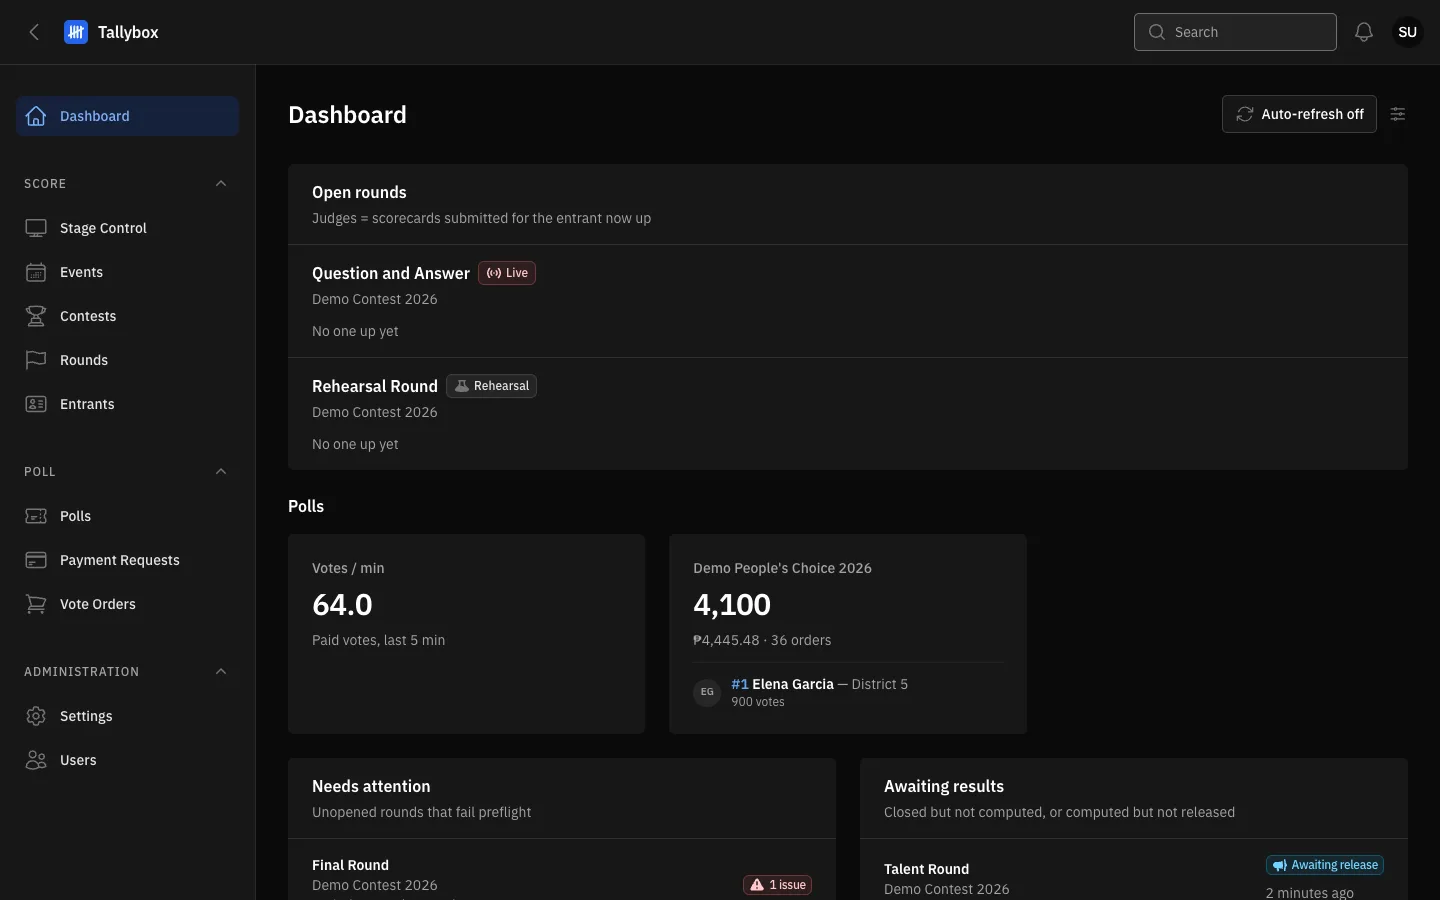
- Votes / min: how fast paid votes are arriving right now.
- One box per open poll: total votes, money and orders.
- The entrant in first place.
Paid votes, hour by hour
The line chart shows paid votes for each hour of the last 24 hours, across all polls. Use the drop-down at its top right to look at one earlier day instead.
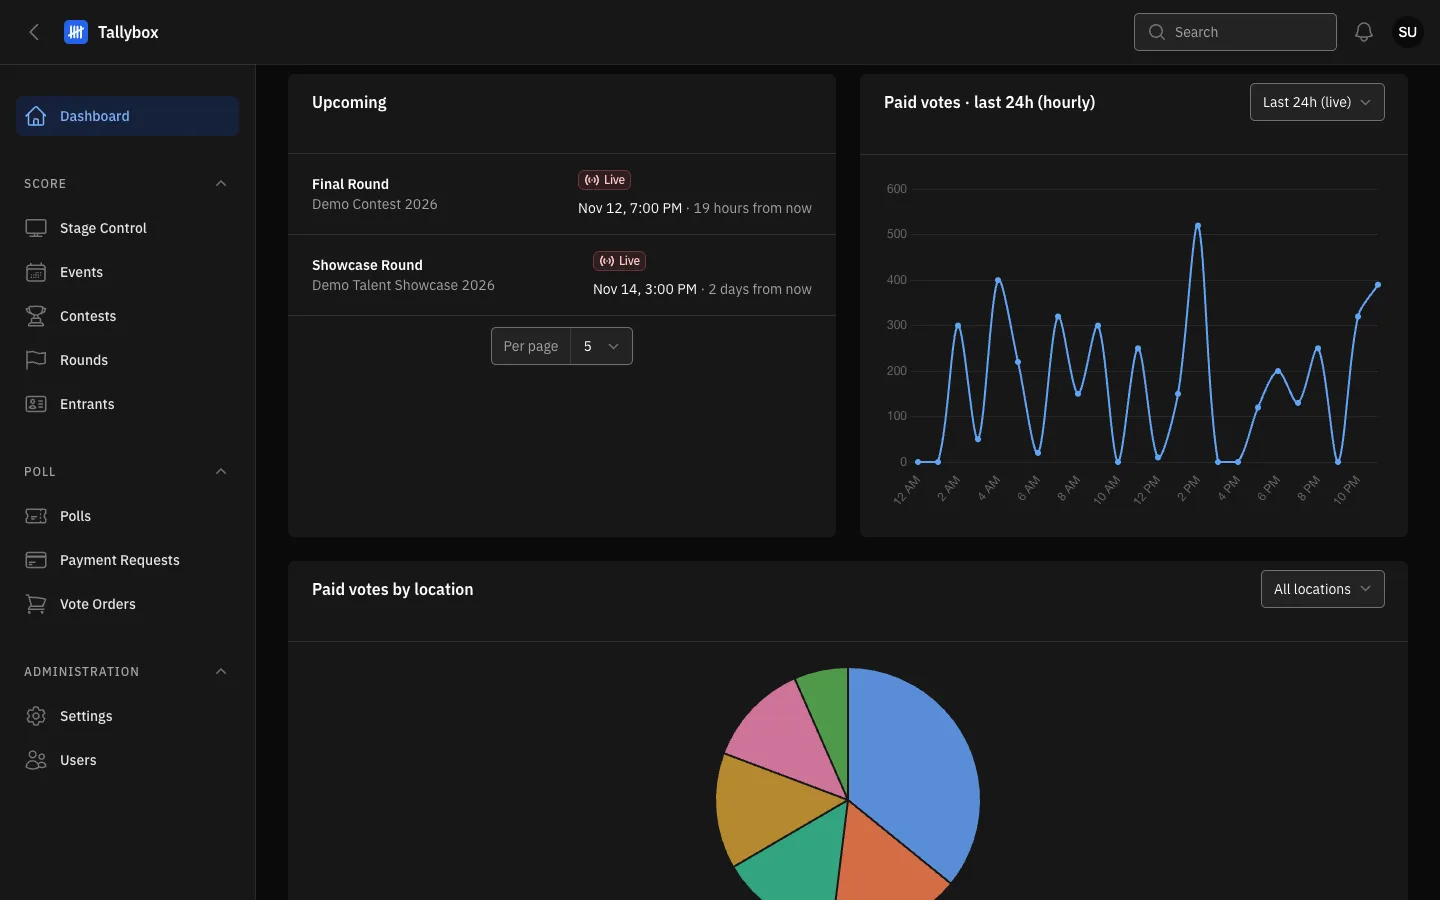
- Drop-down: switch between the last 24 hours and a past day.
- Each point is one hour of paid votes.
Paid votes by location
The pie chart splits paid votes by where the voters said they are. The legend gives each place and its share. Use the drop-down at the top right to look at one place only, or keep All locations.
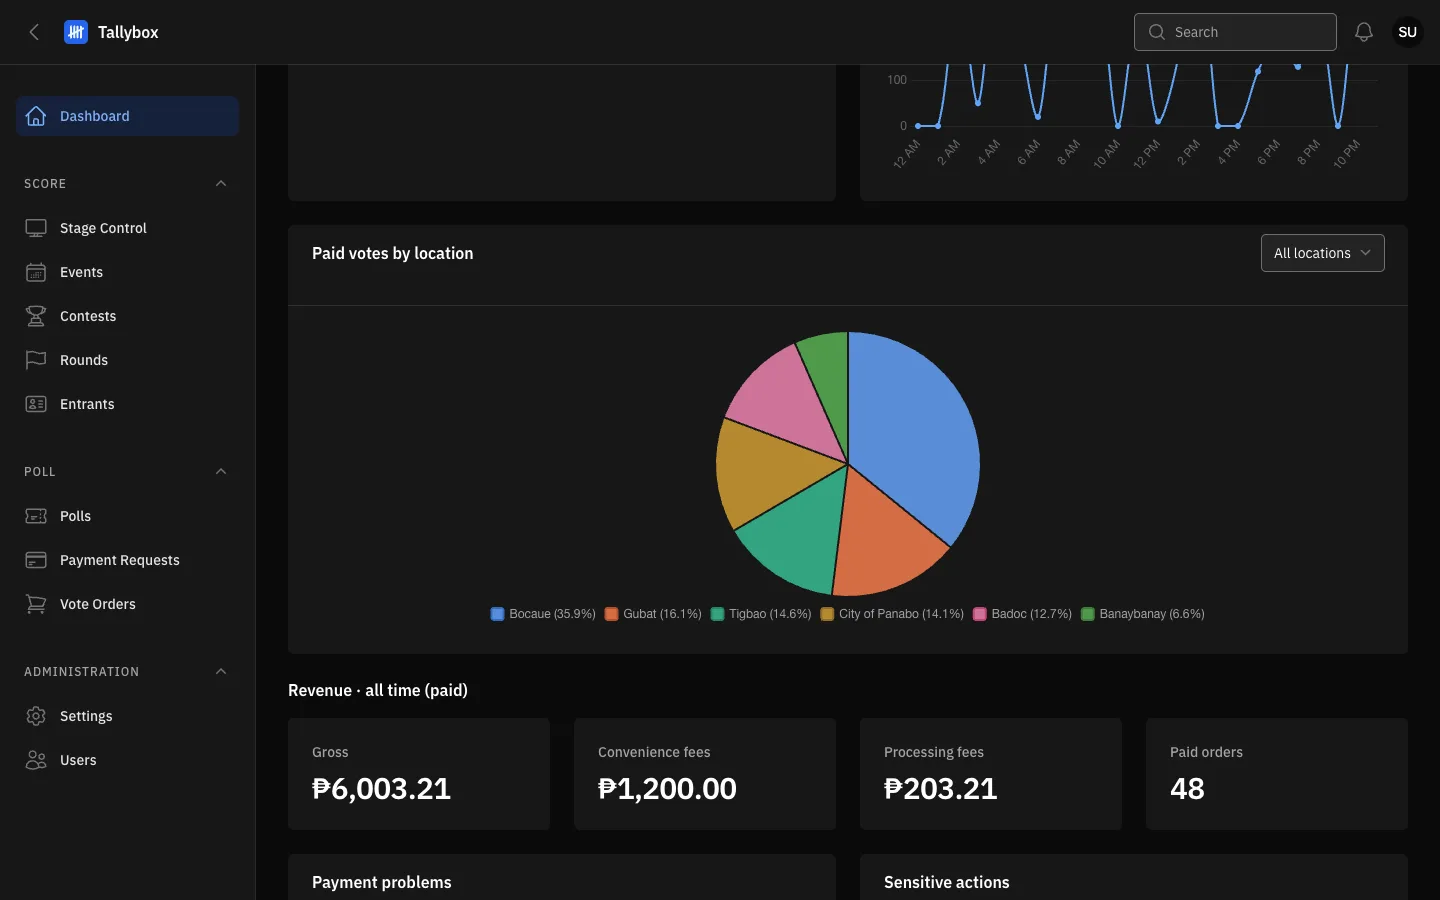
- Drop-down: limit the chart to a place.
- Each slice is one place. The biggest slice is the place with the most paid votes.
- Legend: the place name and its share of all paid votes.
Revenue
Four figures cover every paid order, all time: Gross (all the money taken), Convenience fees, Processing fees and the number of Paid orders. Pending, failed and cancelled orders are not in these numbers.
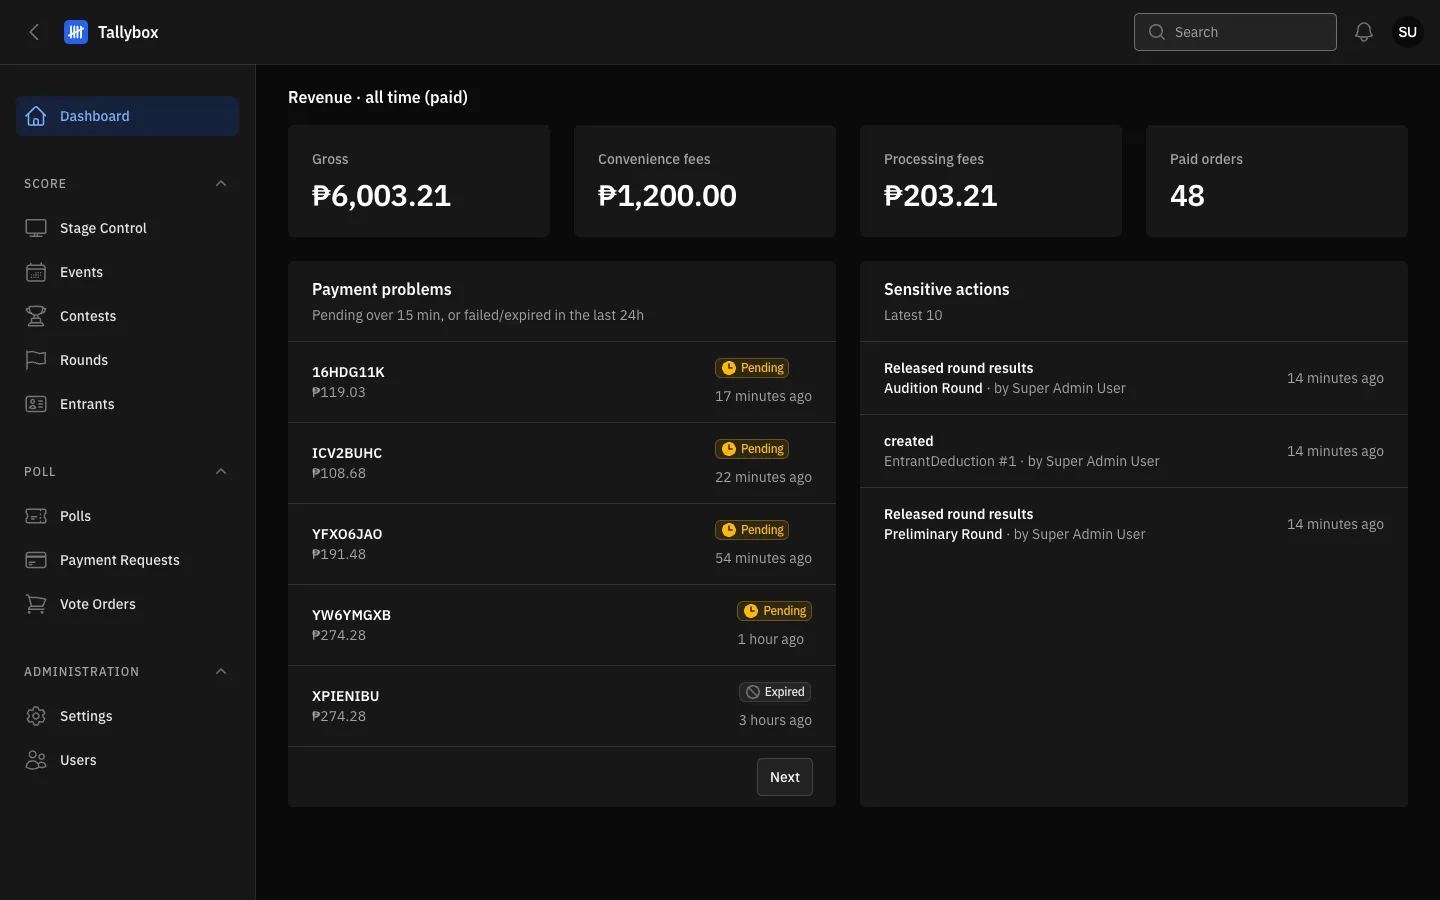
- Gross: all money from paid orders, fees included.
- Paid orders: how many orders were paid.
Payment problems
Only a Super Admin or an Admin sees this box. It lists payments that are Pending for more than 15 minutes, and payments that failed or expired in the last day, with the amount and how long ago. Open Payment Requests to look into one, and re-check it if you think the voter did pay. An empty box is good news.
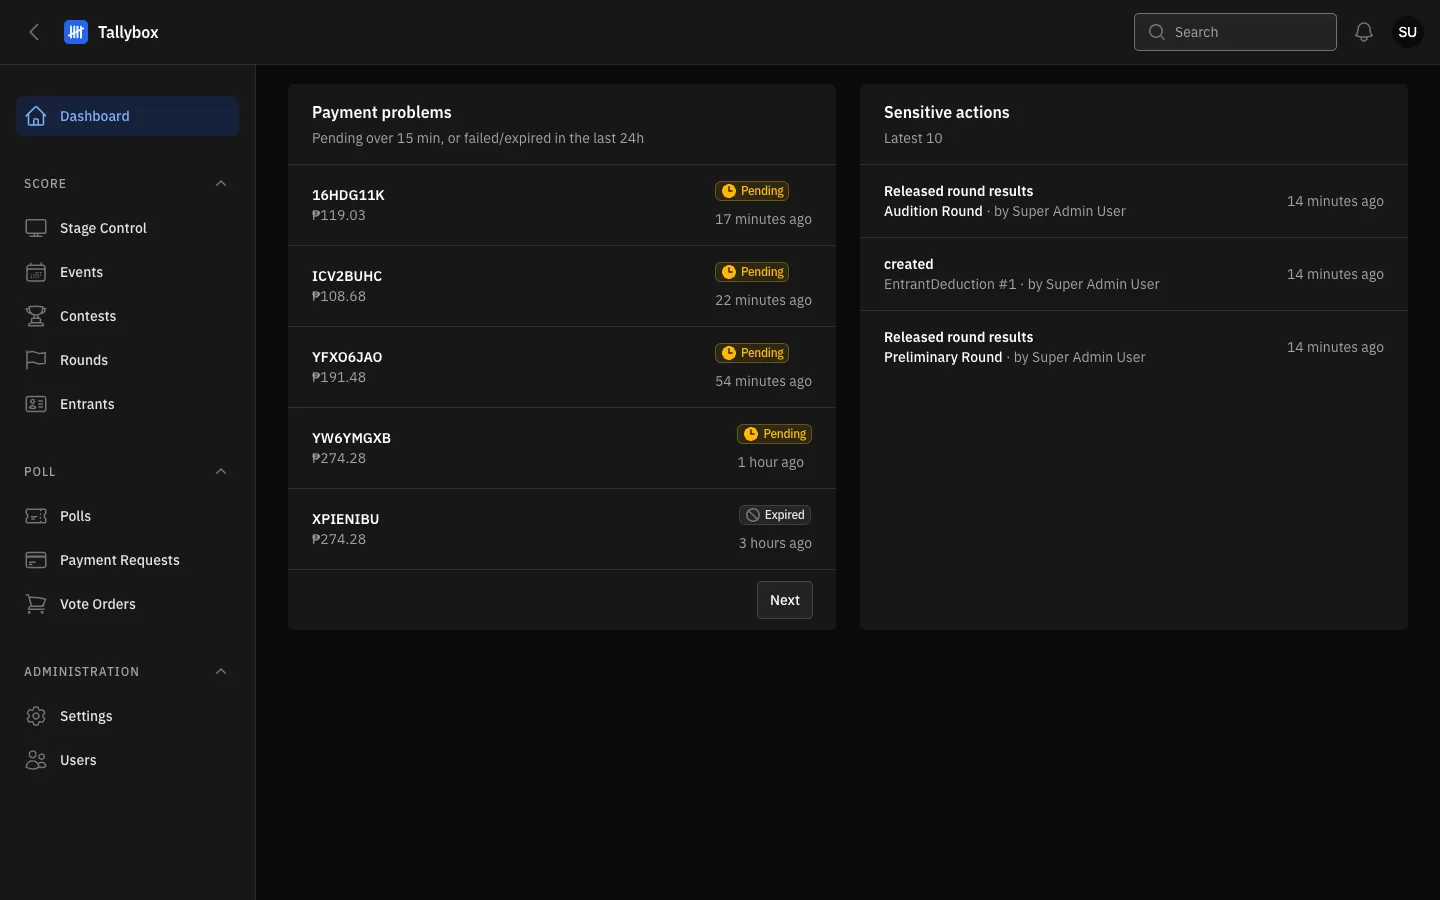
- Pending: waiting more than 15 minutes.
- Each row is one payment request, with its amount.